All projectsData
Analytics and Monitoring Platform
Unified telemetry, KPIs, funnels, and cohort exploration
Live demo
Explore the analytics and monitoring platform
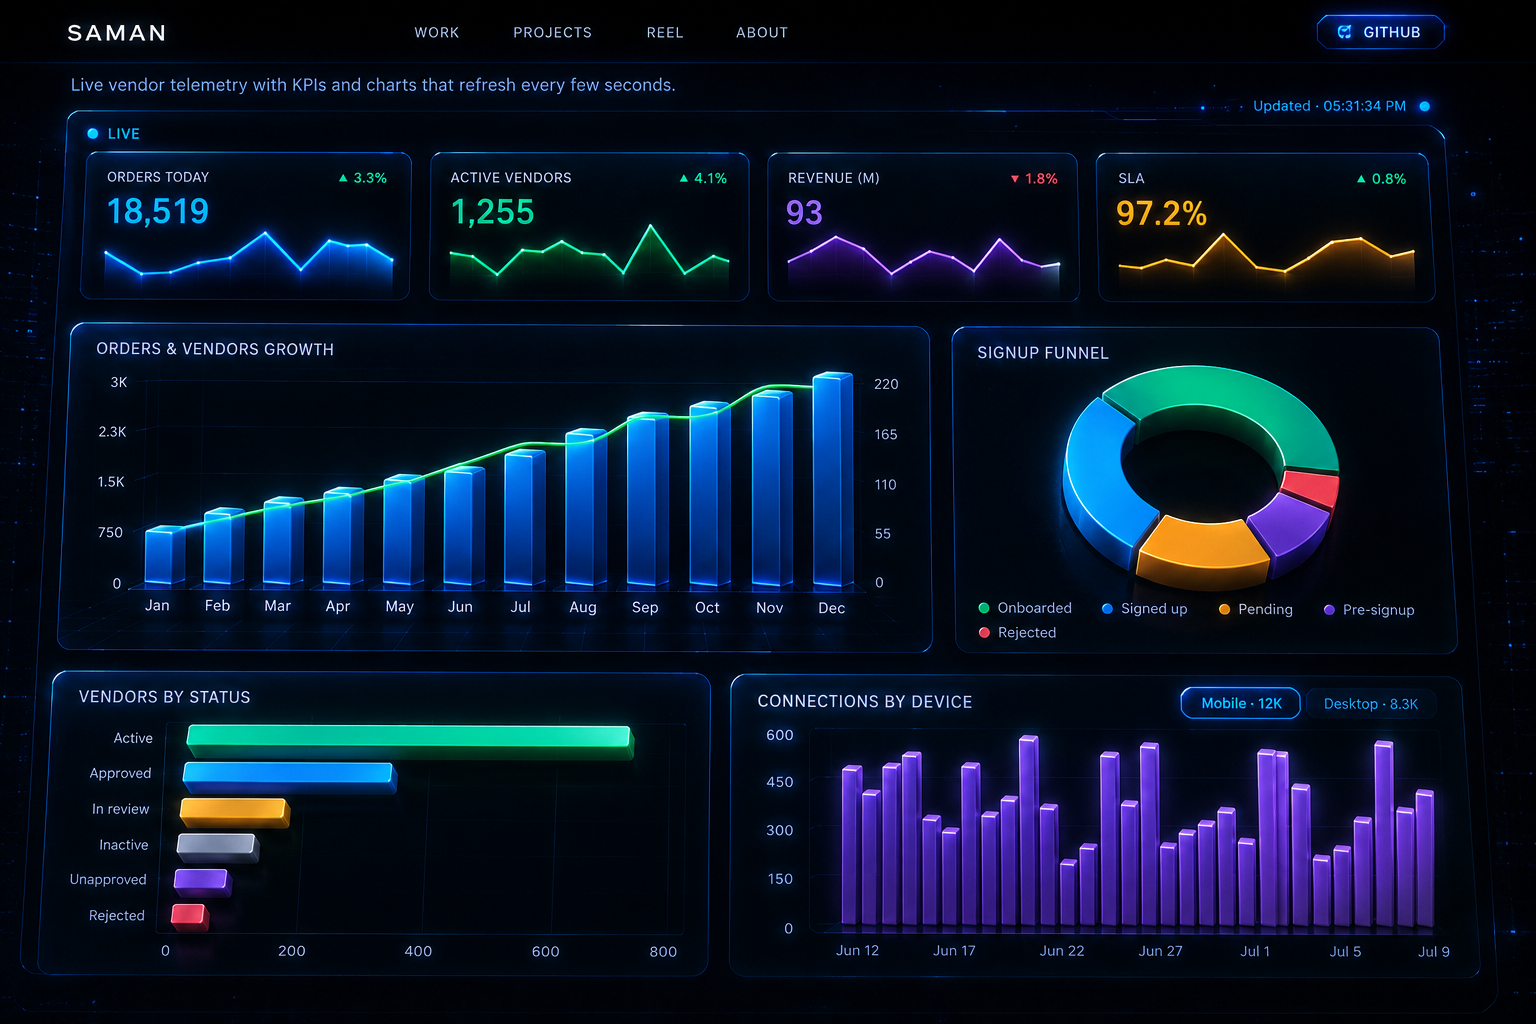
Live KPIs, time-series charts, funnels, cohorts, and operational panels in one unified dashboard.
Powered by a mock API and React Query
Overview
This platform merges operational monitoring with product analytics in one scrollable experience. Operators track vendor health, device mix, and signup funnels alongside event throughput, channel breakdowns, retention cohorts, and top-event tables — all backed by cached, deduplicated queries that stay responsive under high update rates.
Key features
- Live KPI tiles with sparklines and trend indicators
- Composed bar/line charts for growth and throughput
- Pie and vertical bar charts for status and funnel stages
- Device connection charts with desktop/mobile toggle
- Area charts for hourly event and user throughput
- Retention cohort tables and top-events ranking
- Activity feed with platform and recency columns
Highlights
- 12+ chart types across monitoring and analytics views
- Sub-second refresh on streaming mock telemetry
- Shareable exploration patterns via React Query caching
- Single demo combining ops and product intelligence