All projectsData
Analytics Platform
High-volume event ingestion and exploration
Live demo
Explore the analytics platform
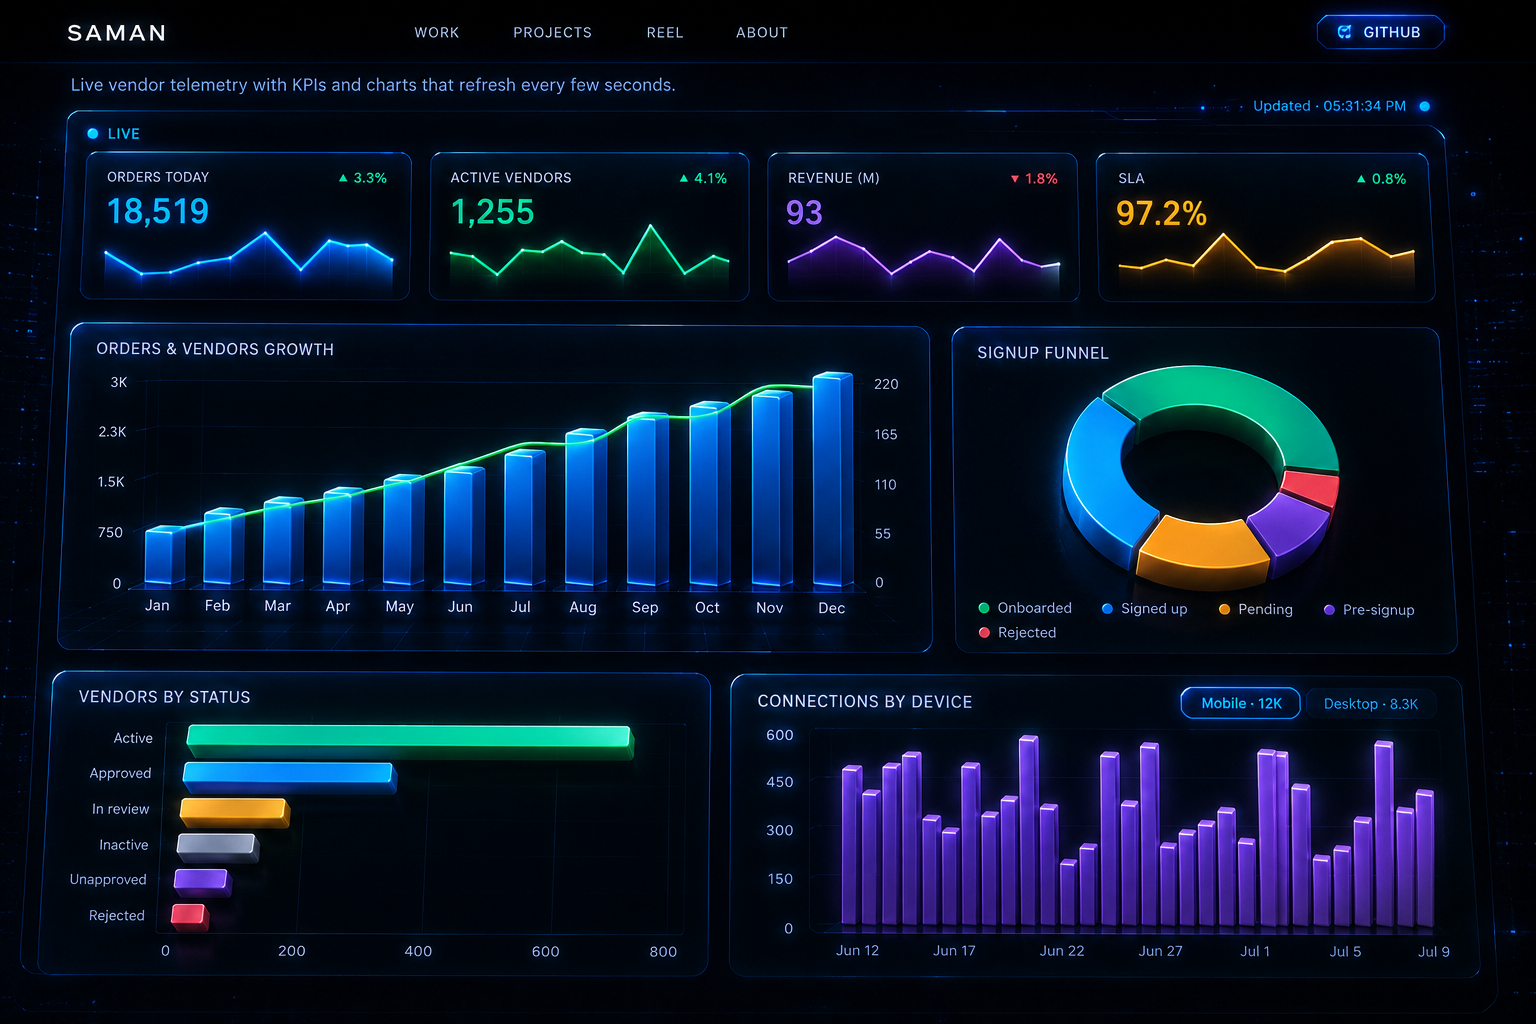
High-volume event exploration with funnels, cohorts, and dimensional slices that refresh live.
Powered by a mock API and React Query
Overview
The Analytics Platform ingests high-volume product events, materialises rollups, and exposes an interactive exploration UI. Analysts slice metrics across channels, inspect conversion funnels, compare retention cohorts, and share URL-encoded views — all backed by cached, deduplicated queries that stay responsive under billions of events.
Key features
- Live KPI tiles for events, users, sessions, and conversion
- Hourly throughput charts with events/users metric toggle
- Vertical conversion funnel from view to retain
- Channel breakdown across web, mobile, API, and partners
- Week-over-week retention cohorts (D1 / D7 / D30)
- Top events table with volume share for quick triage
Highlights
- Interactive queries over billions of events
- Instant aggregates via precomputed rollups
- Shareable exploration state encoded in the URL
- Sub-second UI updates on streaming mock telemetry